

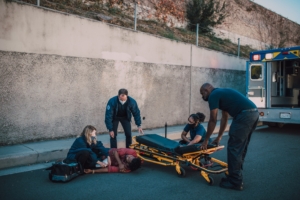
Step off a curb in downtown Los Angeles, or take an e-bike through a busy stretch of San Diego, and the odds of a serious head injury are not what they were five years ago.
E-bike collisions have gone from a statistical rounding error to a real category of trauma.
Pedestrians struck by these vehicles are landing in intensive care at rates that outpace the riders.
And here is the part that catches people off guard: symptoms often show up days later, quietly, while California’s two-year filing clock has already been ticking since the moment of impact.
Consider a cyclist who left Santa Barbara on a long-distance charity ride and ended up in a nine-day coma with a piece of his skull surgically removed.
Or a pedestrian in a Bay Area corridor, struck mid-crossing, admitted with a subdural hematoma.
Neither story is unusual anymore.
Trauma activations tied to bicycles, e-bikes, pedestrians, and rideshare vehicles have been climbing across California hospitals, and the 2024 through 2026 data tells a fairly blunt story about who is getting hurt and how badly.
E-Bike Crashes Keep Stacking Up Across California
Two reported e-bike collisions in California in 2018. By 2024, that number hit 1,506.
That is not a gradual upward drift.
Researchers at UC San Diego published an analysis in Trauma Surgery and Acute Care Open in July 2026 comparing 4,035 e-bike crashes with 58,332 traditional bicycle collisions over the same period.
E-bike riders came out worse on moderate-to-severe injuries.
The age breakdown is the detail that tends to stop people mid-sentence, though.
Riders aged 14 and under made up 15.6 percent of injured e-bike users, compared with 10.2 percent for conventional bikes.
Physics is not really negotiable here.
More speed plus more mass equals crash forces that sit closer to motorcycle territory than anything resembling a Schwinn.
Riders feel steady and in control right up until they are not, and helmet use among injured riders remains stubbornly low, which does the head no favors at all.
For anyone tracking case volume on the legal side, these numbers indicate a claim category that is expanding rapidly and demanding better documentation than the average bicycle file.
Speed at impact, force estimates, helmet status, and the mechanical characteristics of the specific bike all start to matter.
Firms like Cutter Law publish California-focused information on personal-injury claims involving vulnerable road users, which can help families and practitioners get oriented to how liability and damages tend to shake out.
It is background reading, not a substitute for counsel, but it is useful background.
The same study also recorded a meaningful jump in e-bike deaths during 2024, even though overall mortality rates between e-bike and traditional bicycle riders stayed roughly comparable across the full study window.
California built out a micromobility network with real transportation upside.
The injury curve came along with it.
Pedestrians Take the Worst End of It
Here is the finding that reframes the whole conversation.
When micromobility vehicles hit pedestrians, the pedestrian typically fares worse than the rider by a wide margin.
A retrospective cohort study in the Journal of Craniofacial Surgery, covering 2020 through 2024 admissions at a Level-1 trauma center, found moderate or severe TBI in 71.4 percent of pedestrian cases versus 56.7 percent of rider cases.
Subdural hematoma showed up in 58.6 percent of pedestrians compared with 37.8 percent of riders.
ICU admission was 82.9 percent against 59.4 percent.
Out of 250 patients reviewed, 70 were pedestrians who had been struck.
Micromobility-related neurocranial trauma at that center more than doubled, from 25 cases in 2020 to 59 in 2024, and pedestrian admissions tripled over the same period.
Zoom out and the statewide picture holds up.
Mapping published by the San Francisco Chronicle, drawing on UC Berkeley’s Transportation Injury Mapping System, counted nearly 6,500 pedestrians and bicyclists killed in California between 2020 and 2024, roughly 800 of them cyclists.
Annual totals peaked at 1,429 in 2022 and eased somewhat to 1,208 in 2024.
Better, yes.
Still an enormous number of people.
Walk beside a bike lane for five minutes, and the vulnerability gap makes intuitive sense.
No frame, no helmet, no bracing.
What the clinical record adds is the specificity: higher rates of frontal-bone fracture, more intracranial-pressure monitoring, more surgical evacuation among pedestrians.
Practically speaking, that means longer admissions, heavier rehabilitation demands, and damages calculations that get complicated in a hurry.

Symptoms That Show Up Late and Deadlines That Do Not Move
Mayo Clinic materials list bicycle and pedestrian collisions among the standard mechanisms behind traumatic brain injury
. Mild cases tend to bring headache, nausea, dizziness, confusion, trouble with memory or concentration, mood changes, and disrupted sleep.
Moderate-to-severe presentations add prolonged loss of consciousness, seizures, pupil dilation, clear fluid draining from the nose or ears, and cognitive or behavioral changes that are hard to miss.
Some of it surfaces immediately.
Some of it takes a week or two to announce itself.
Common delayed or evolving symptoms include:
- Headache that persists or gets worse instead of better
- Memory gaps or trouble holding concentration
- Balance problems and dizziness
- Mood swings, irritability, or new anxiety
- Sensitivity to light or sound
- Sleep that will not settle into a normal pattern
Someone can climb out of a rideshare after a fender-bender, or get up after a bicycle fall, feeling shaken but basically fine.
Then two weeks later they cannot follow a conversation at work or keep their balance on a staircase.
That gap between event and recognition is where a lot of cases quietly fall apart.
California Code of Civil Procedure section 335.1 sets a two-year statute of limitations for most negligence-based personal-injury actions.
The clock generally starts on the date of injury.
Discovery-rule principles can apply where the injury or its cause was not reasonably apparent at the time, but relying on that as a plan rather than a fallback is a rough strategy.
National numbers from the Centers for Disease Control and Prevention (CDC) put TBI-related hospitalizations at roughly 214,110 in 2020 and TBI-related deaths at 68,663 in 2023.
Break that down, and it works out to more than 586 hospitalizations and about 190 deaths every single day, with motor-vehicle, bicycle, and pedestrian mechanisms all well represented.
Early evaluation and a carefully kept timeline are not just good medicine.
They are frequently what makes a claim viable months down the road.
So what happens when those same congested streets are also full of rideshare vehicles pulling over, idling, and merging back into traffic?
Dedicated rideshare-specific TBI statistics are thin, which is a real limitation.
The broader motor-vehicle and vulnerable-road-user data still fills in enough of the picture to be useful.
CDC bicycle-safety reporting counts close to 1,000 bicyclist deaths a year in motor-vehicle crashes nationwide, plus something in the neighborhood of 120,000 emergency-department visits for non-fatal injuries.
Age-adjusted pedestrian and pedal-cyclist injury death rates across the country climbed from 2.1 to 2.9 per 100,000 between 2013 and 2023, according to CDC and NCHS trend analysis, with the West running above average.
California has the urban density and the rideshare penetration to sit right in the middle of that trend.
A passenger swinging a door open into a bike lane, a cyclist holding a shared lane, a pedestrian stepping through a curb cut- all of them are subject to the same unforgiving physics.
When a brain injury comes out of it, the resulting claim can involve the driver, the platform, and occasionally the roadway design itself, which turns liability analysis into a layered exercise rather than a straightforward one.
Policy is starting to catch up, slowly.
California’s speed-camera pilot programs, covered in some detail by CalMatters, are aimed squarely at the high-speed arterial crashes that produce the most catastrophic pedestrian and cyclist outcomes.
Whether the pilots scale is another question entirely.

What Recovery Actually Looks Like
Helmets help.
They do not make anyone invincible.
Brett, an experienced cyclist, set out from Santa Barbara on a cross-country charity ride.
He fell, landed on his head, and sustained a subdural hematoma.
Surgeons removed a portion of his skull to manage the swelling.
Nine days in a coma followed, then a transfer to Stanford Hospital for cranioplasty and multi-specialty rehabilitation.
Embed YouTube video on site here: https://www.youtube.com/watch?v=-2cTOQycOm4
What he described afterward tracks closely with the literature.
Short-term memory loss.
Balance trouble.
Left-side motor deficits.
Seizures that developed later.
He measured his daily function against his pre-injury baseline and clawed back capacity over time, and his clinicians pointed to integrated, coordinated care as a significant part of why that worked.
Post-traumatic epilepsy, hydrocephalus, chronic headaches, and cognitive or emotional changes are all documented downstream effects, and managing them well tends to require neurosurgery, trauma, and rehabilitation teams that actually talk to each other.
A 2024 JAMA Surgery analysis, highlighted by UCSF researchers, documented a 49-fold increase in e-bike riders seeking hospital care for head injuries, reaching close to 8,000 cases in 2022, alongside a 43-fold rise in related hospitalizations between 2017 and 2022.
Helmet use dropped nearly 6 percent annually across that same window.
Riders without helmets were almost twice as likely to sustain a head injury, which is the kind of finding that surprises no one and yet keeps needing to be repeated.
Work published in the European Journal of Trauma and Emergency Surgery pushes the point further, showing that e-bike TBI patterns resemble motorcycle trauma more than traditional bicycle trauma, especially in unhelmeted riders.
Long-term consequences can run through intellectual, communication, behavioral, and sensory function, all of which feed directly into future medical costs and economic damages.
Complex TBI claims arising from bicycle, pedestrian, or rideshare crashes tend to live or die on how well the medical record is organized.
For readers curious about the support side of that work, there is a companion guide on how to become a personal injury paralegal covering the education, skills, and daily responsibilities involved.
Why This Matters for California Claims in 2026
Put the pieces together.
Micromobility use keeps expanding.
Pedestrians are absorbing the worst neurological outcomes.
Symptoms often lag behind the crash by days or weeks.
The statute of limitations does not care about any of that and runs on its own schedule.
E-bike collisions have grown at a rate that would look like a typo if the source were less reliable.
Moderate-to-severe TBI is showing up more often in riders and considerably more often in pedestrians.
The national hospitalization and death figures have not budged in any encouraging direction.
Recovery can take years of specialized care while the legal window stays exactly two years wide.
This information is educational and is not medical or legal advice.
Traumatic brain injuries vary enormously in how they present and how they resolve.
Professional medical evaluation and qualified legal counsel remain essential for any individual situation, and statutes of limitations carry exceptions and factual wrinkles that only case-specific analysis can sort out.
Anyone working in or around this space, whether building a legal career or navigating a claim after an injury, is better served by staying current on the data and the procedural rules.
The landscape is moving.
Preparation beats scrambling.



Leave Your Comment